
Some of our value-added services include:
- Complete SKU analysis of profitability and ROI
- Identification of underperforming products in your catalogue
- Stock liquidation strategies
- Failed launch turnaround expertise
- Account suspension support with proven 72-hour resolution
In one case: We helped a client whose main product (80% of revenue) was suspended. Our support saved thousands in suspension consultants, hundreds of thousands in lost revenue, and restored the listing within 72 hours.
Case Study Overview
To demonstrate our capabilities, we’ve selected three different brands across tiers 1–3. Each presents unique challenges:
| Brand Type | SKU Count | Revenue Range | Market | Category |
|---|---|---|---|---|
| Tier 1 | Large catalogue | 7 figures | EU (multiple markets) | Home & Garden |
| Tier 2 | Medium catalogue | 6–7 figures | US | Office Products |
| Tier 3 | Small catalogue | 6 figures | US | Home & Kitchen |
The timeline covers summer through Q4, demonstrating management through both low season (typically challenging) and high season (Christmas peak).
Tier 3 Client Results
Sales vs Spend
Sales increased from $58,494.93 to $122,626.03 (109.64% growth), with spend increasing from $13,492.13 to $20,306.28.
ACoS (Advertising Cost of Sale)
ACoS reduced by 6.51% over the period (from 23.07% to 16.56%) – a 28.21% improvement. When we signed the account, it had a 27% ACoS, representing an overall reduction of 10.44%.
Orders Per Month
Orders increased from 2,304 to 4,971 (115.76% growth), through a combination of current and seasonal product variations and optimisation in peak season.
Organic vs PPC Sales
PPC contribution increased slightly from 31.38% to 35.42% (12.86% change) during the analysis period.
Average Spend Per PPC Sale
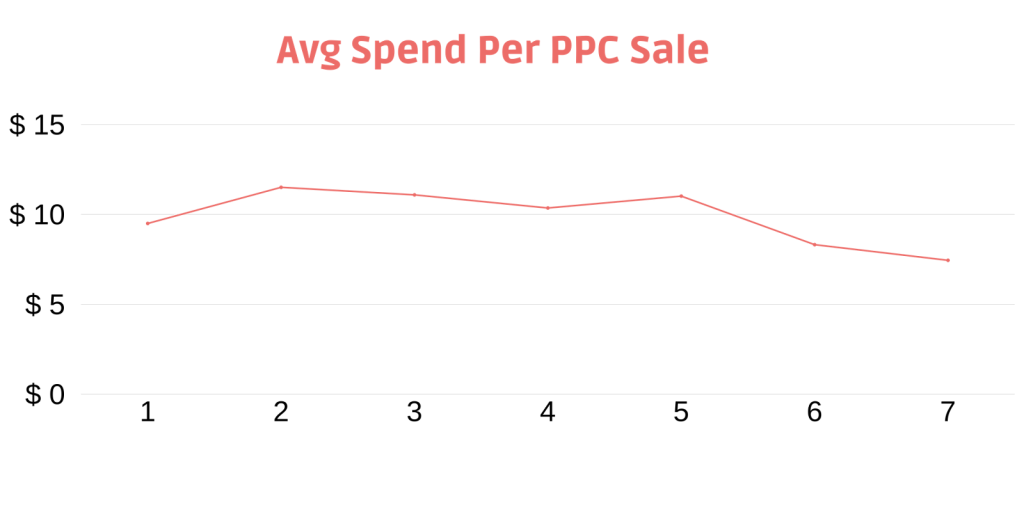
PPC acquisition costs reduced from $5.86 to $4.08 (30.24% improvement).
Average Revenue Per PPC Sale
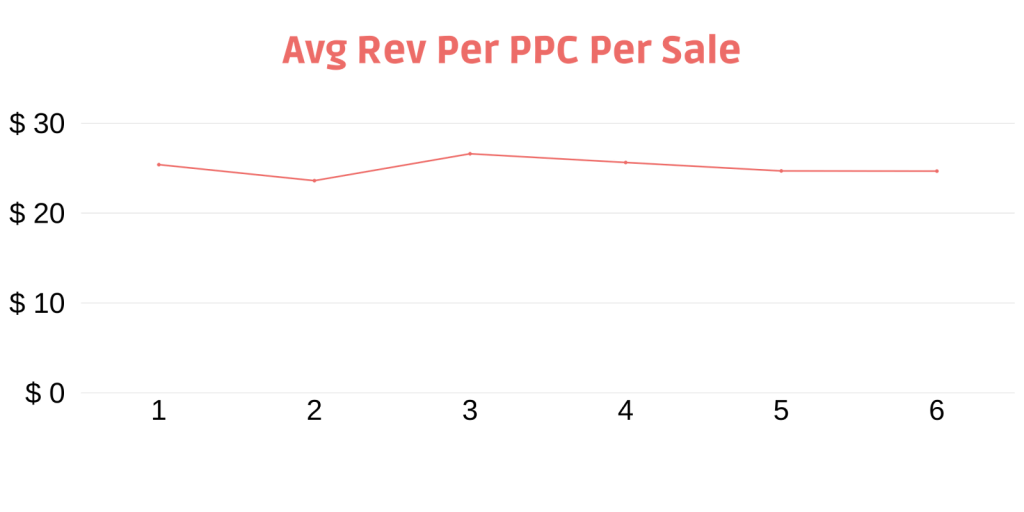
Average revenue decreased slightly from $25.39 to $24.67 per unit (-2.84%).
Average Clicks to PPC Conversion
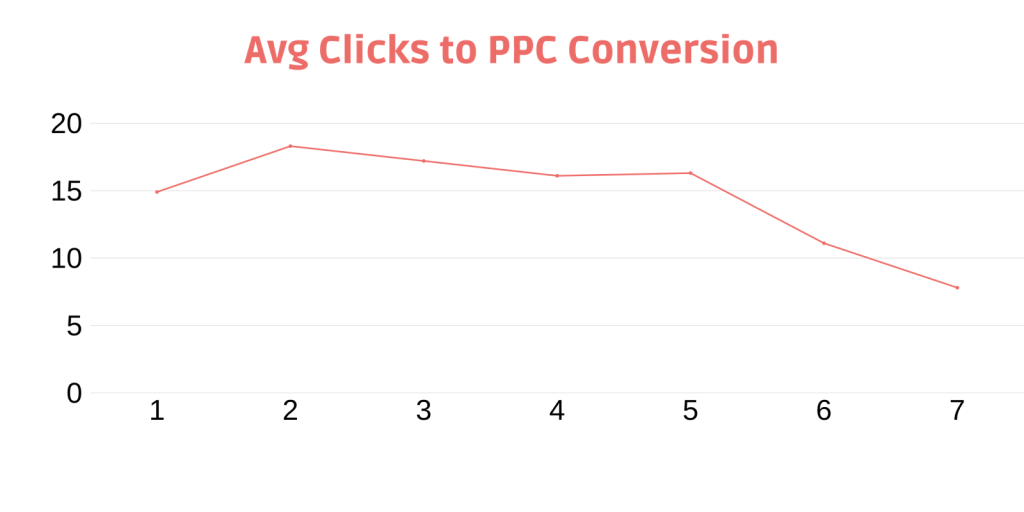
Clicks required for conversion decreased from 9.0 to 6.5 (27.21% improvement), demonstrating better targeting and relevance.
Average Impressions to PPC Conversion
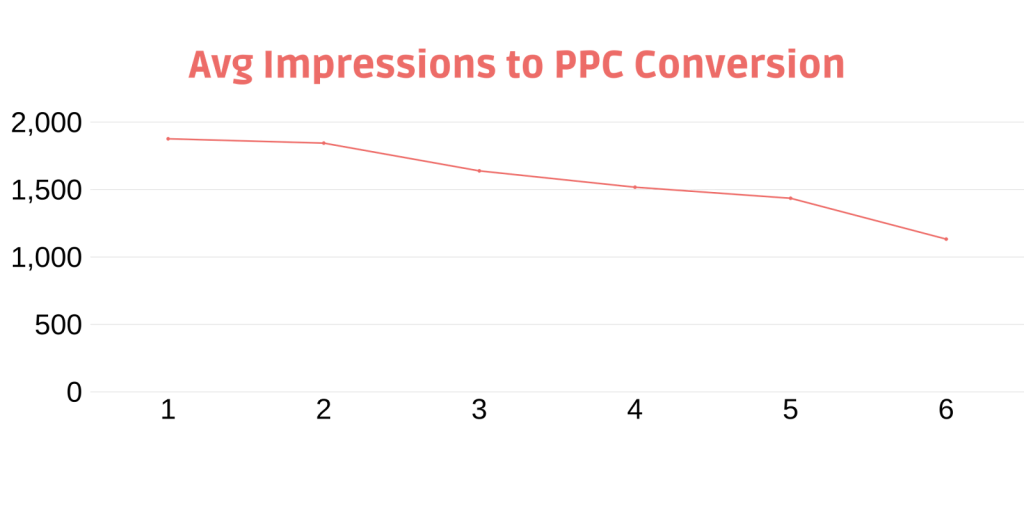
Impressions decreased from 1,877 to 1,133 (39.66% reduction), helping improve Click Through Rate.
Total Revenue
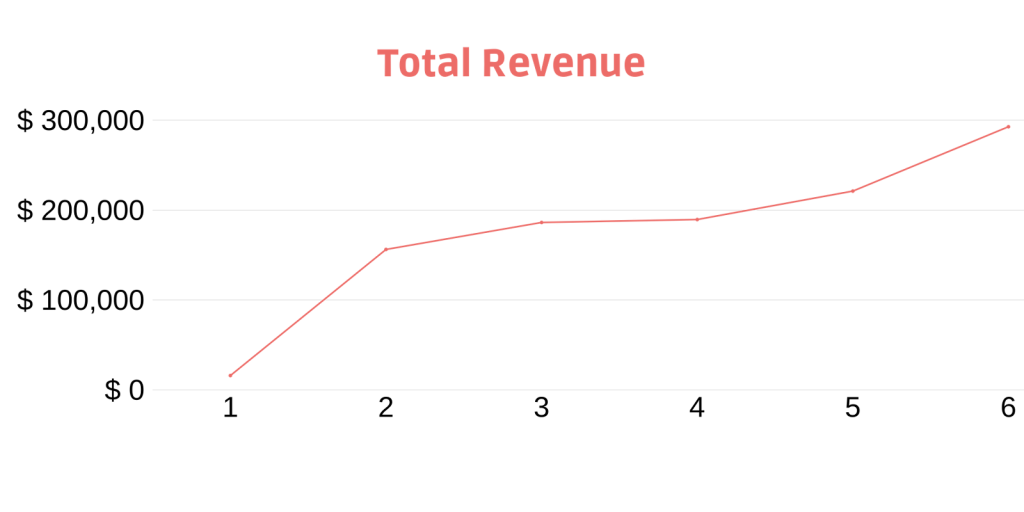
Overall revenue grew from $159,972.58 to $292,721.11 (82.98% growth).
Tier 2 Client Results
Sales vs Spend
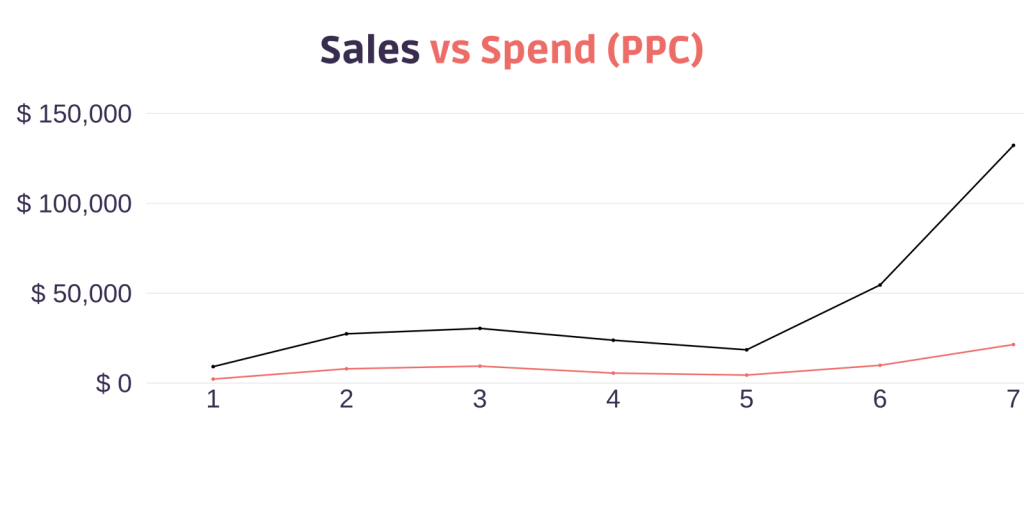
Sales increased from $9,175.65 to $132,272.30 (1,341.56% growth), with spend increasing from $2,252.56 to $21,460.76.
ACoS (Advertising Cost of Sale)
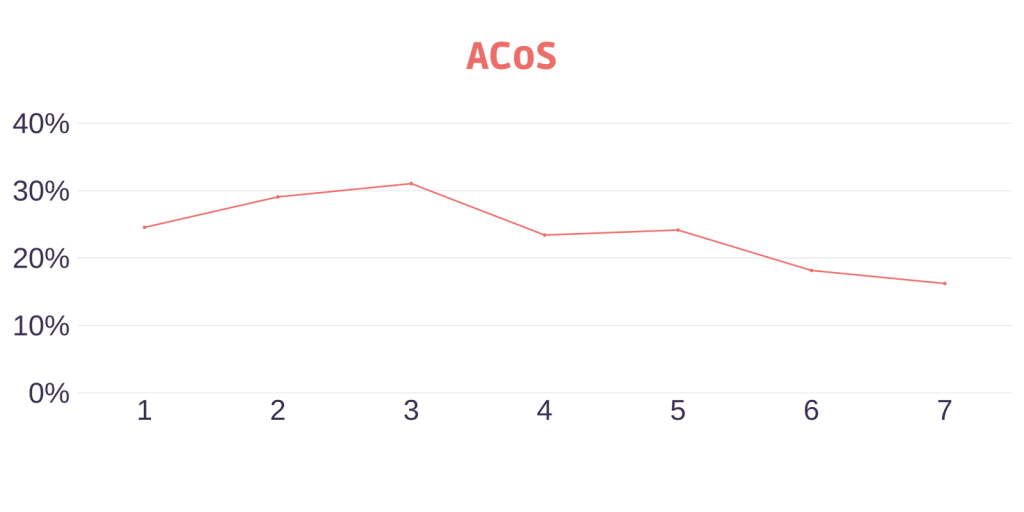
ACoS reduced from 24.55% to 16.22% (33.91% improvement).
Orders Per Month
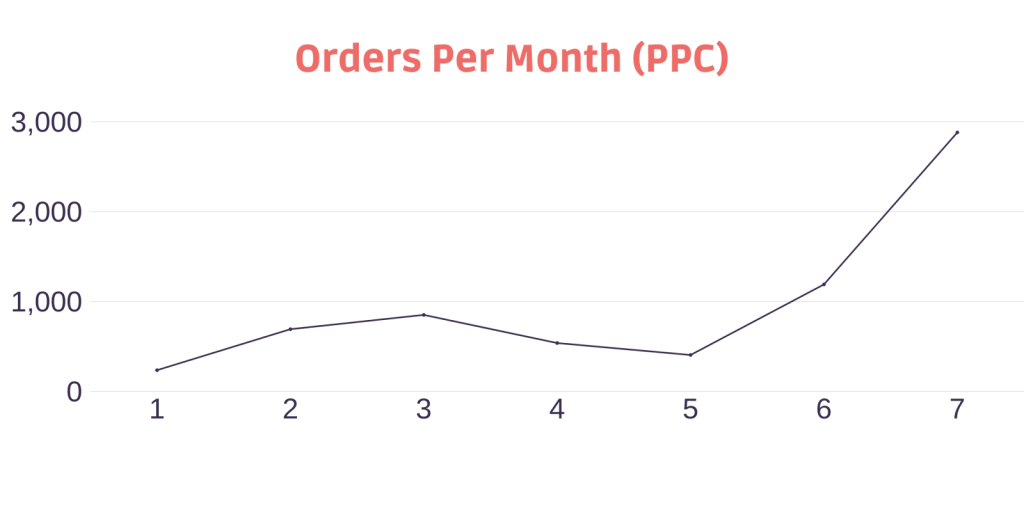
Orders increased dramatically from 237 to 2,882 (1,116.03% growth), through optimisation and new product launches during peak season.
Organic vs PPC Sales
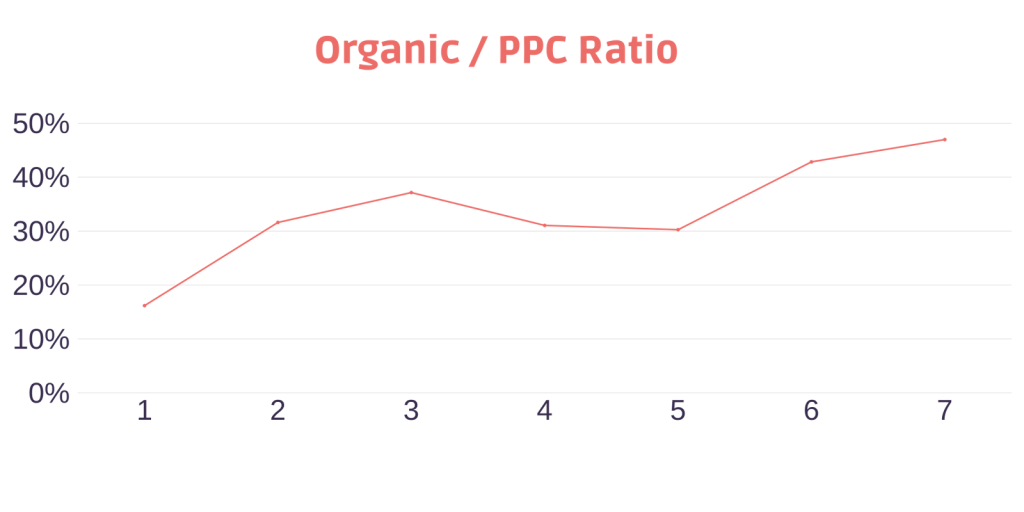
PPC contribution increased from 16.17% to 46.97% (190.53% growth), while maintaining profit per unit or break-even pricing.
Average Spend Per PPC Sale
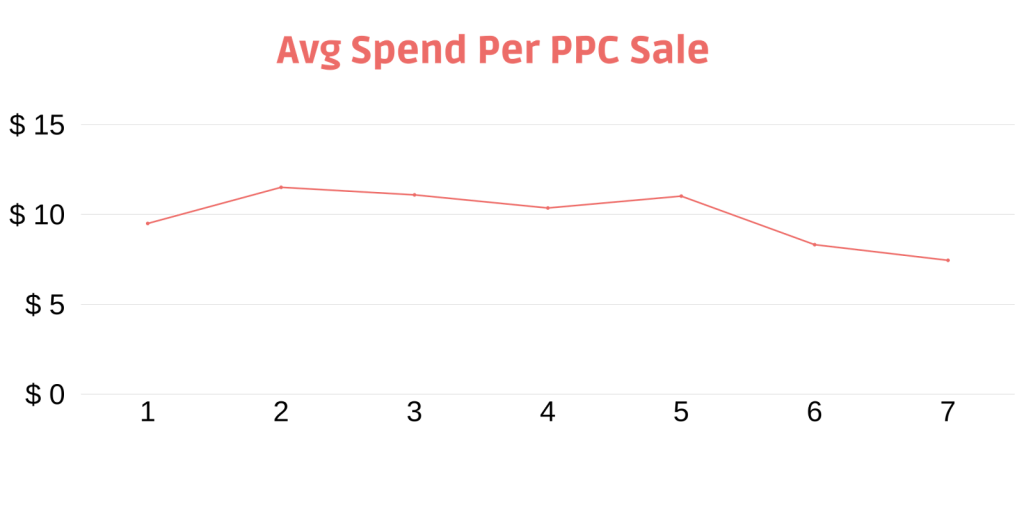
PPC acquisition costs reduced from $9.50 to $7.35 (21.65% improvement).
Average Revenue Per PPC Sale
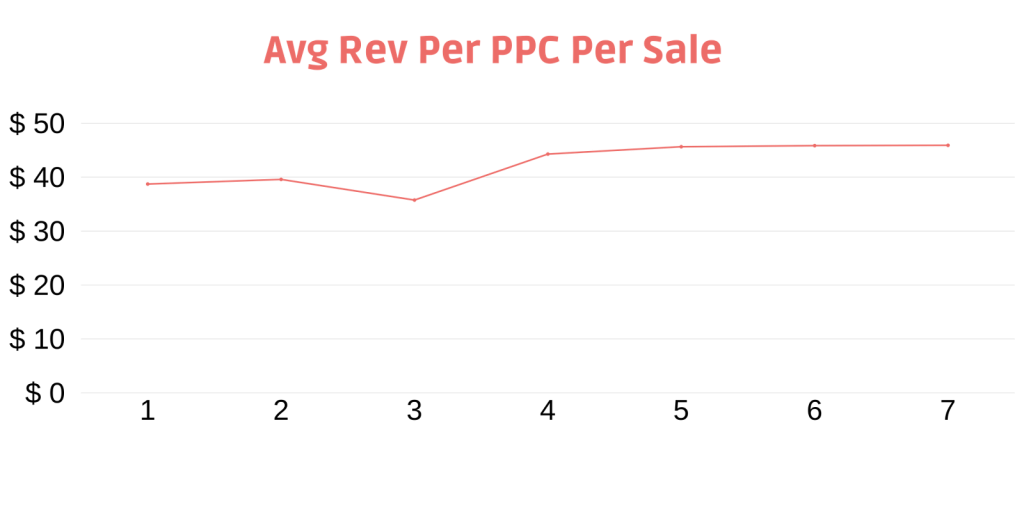
Average revenue increased from $38.72 to $45.90 per unit (18.55% improvement).
Average Clicks to PPC Conversion
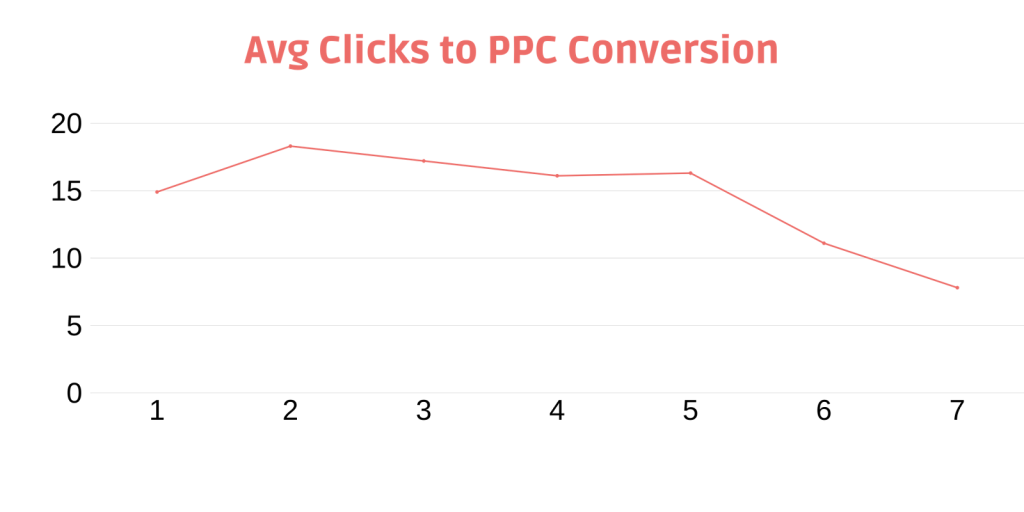
Clicks required for conversion decreased from 14.9 to 7.8 (47.48% improvement), demonstrating better targeting and listing optimisation.
Average Impressions to PPC Conversion
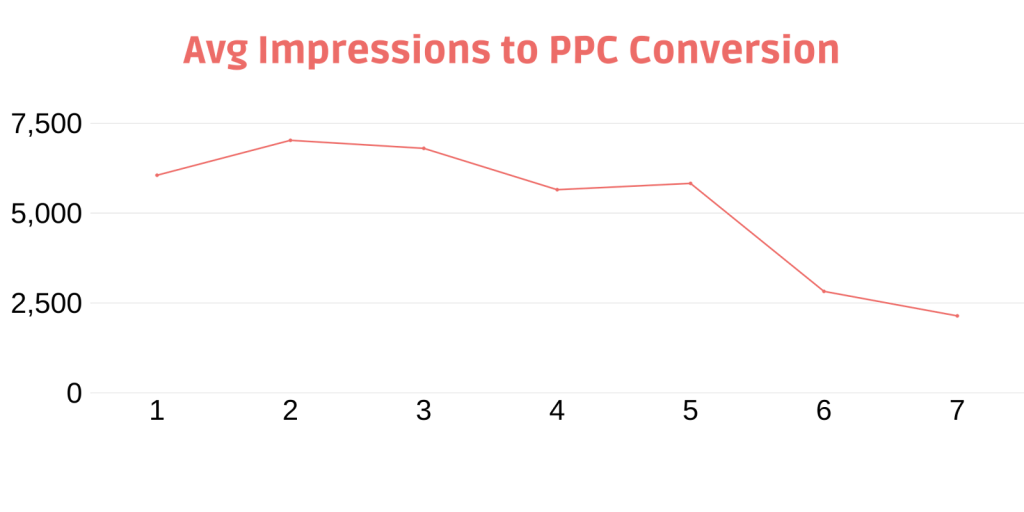
Impressions decreased from 6,053 to 2,141 (64.63% reduction), showing higher relevance and streamlined targeting.
Total Revenue
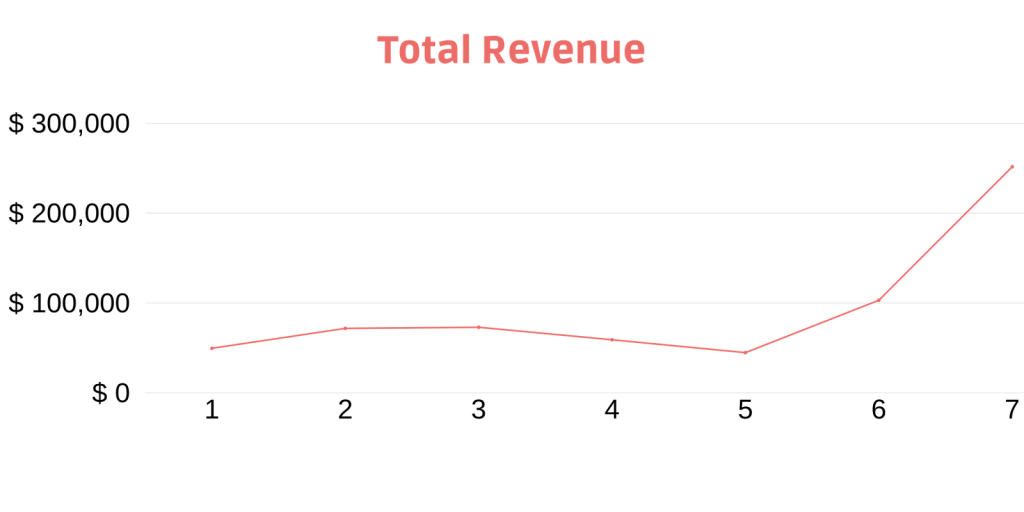
Overall revenue grew from $49,591.90 to $251,538.80 (407.22% growth).
Tier 1 Client Results
Sales vs Spend
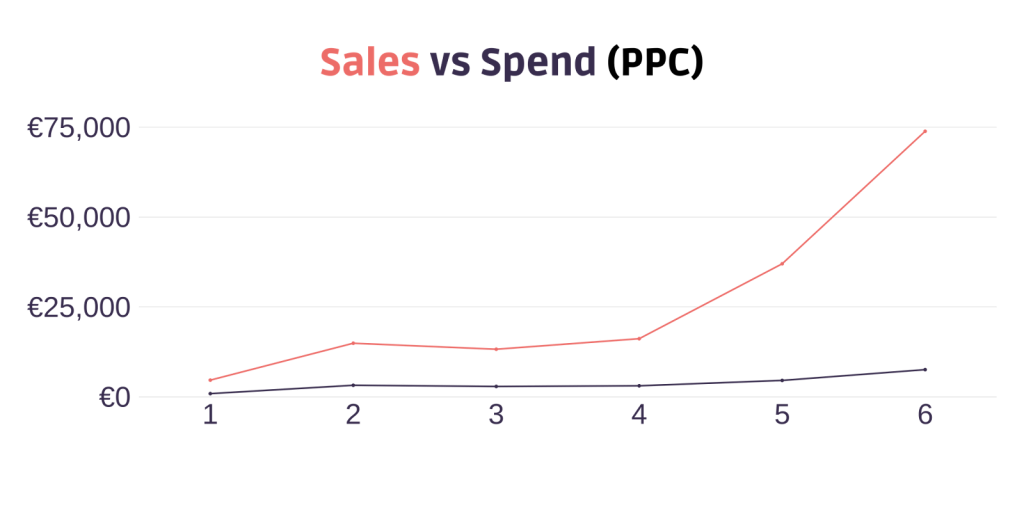
Spend increased from €905 to €7,572, with sales growing from €4,657 to €73,875 (1,486.31% growth).
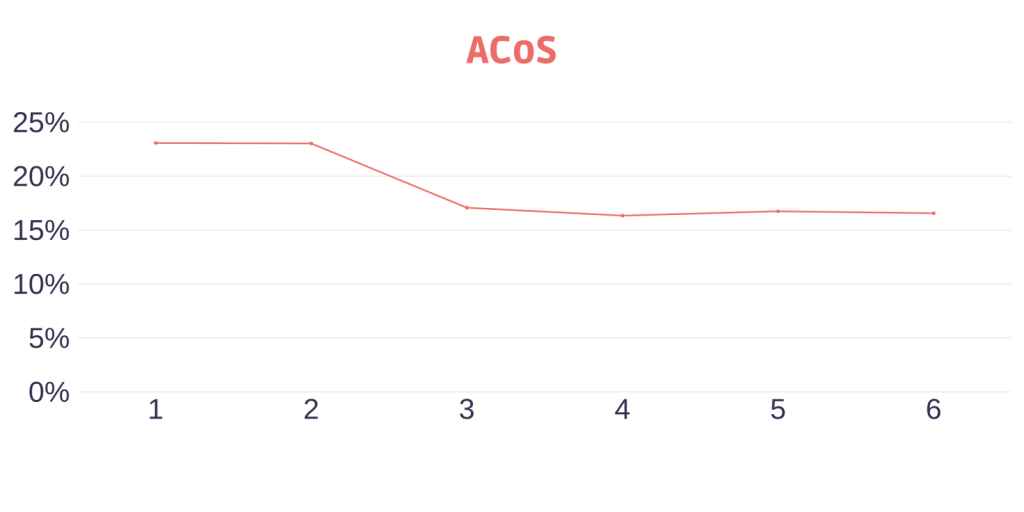
ACoS (Advertising Cost of Sale)
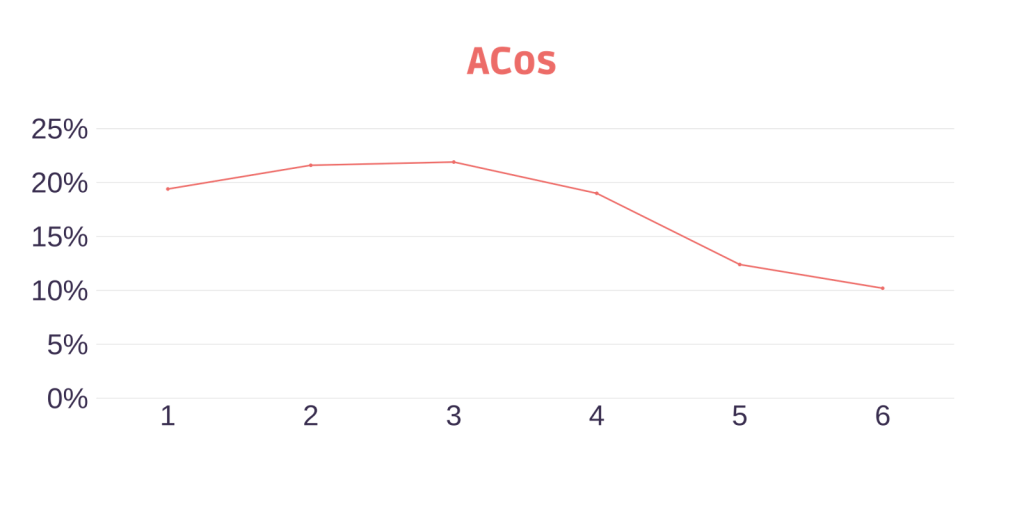
ACoS reduced from 19.43% to 10.25% (47.25% improvement).
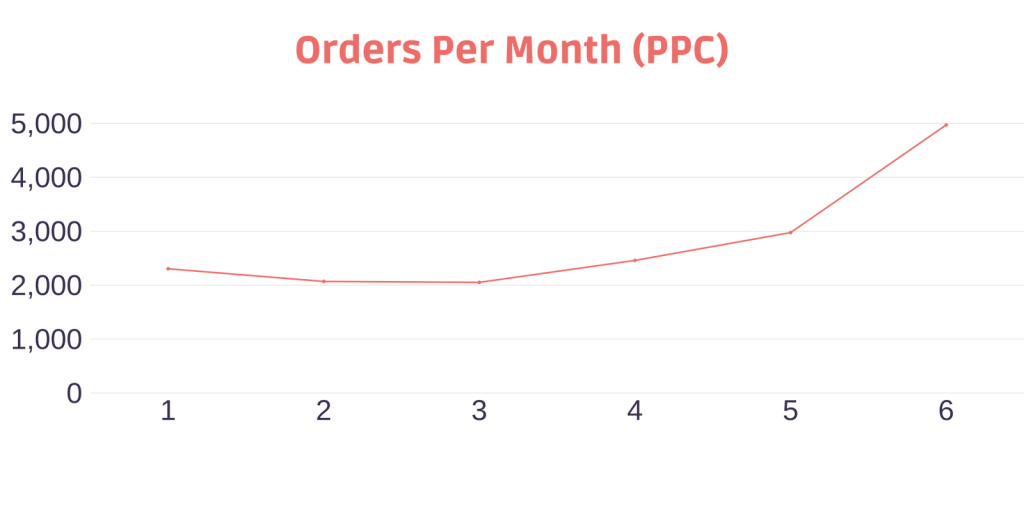
Orders Per Month
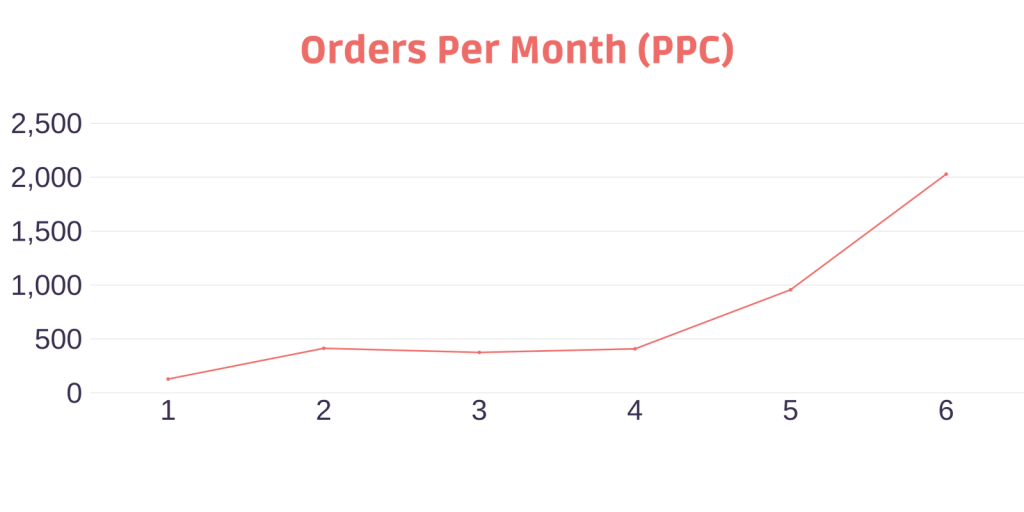
Orders increased from 128 to 2,028 (1,484.38% growth), with no new product launches during this period.
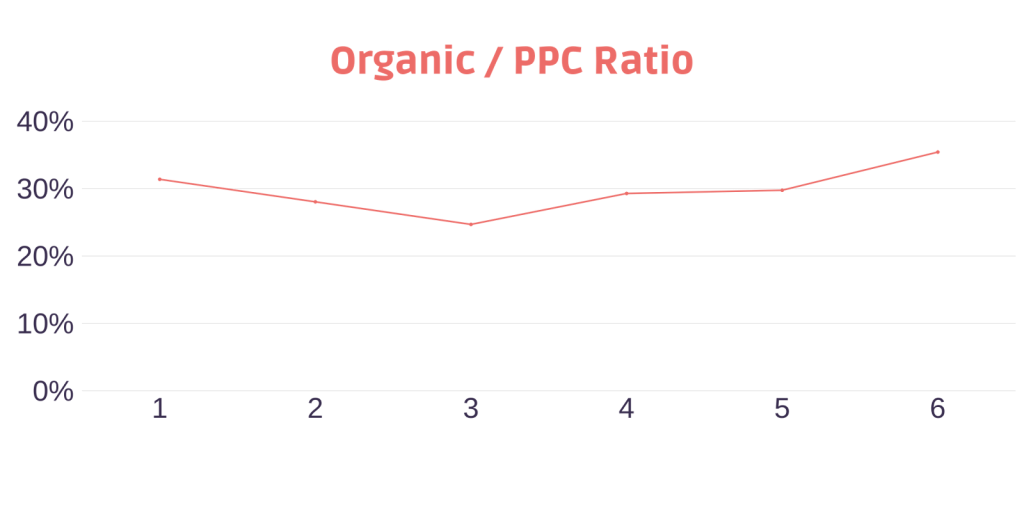
Organic vs PPC Sales
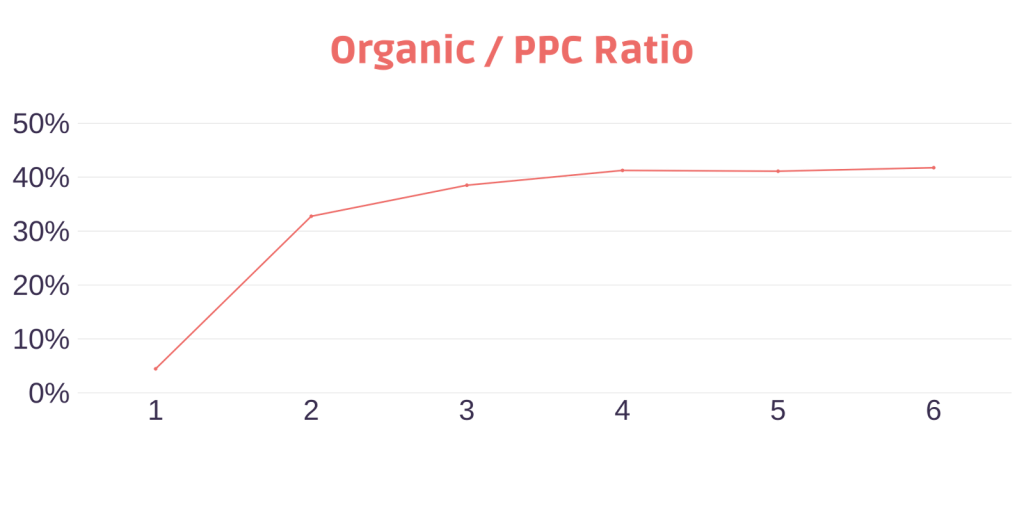
PPC contribution increased from 4.46% to 41.75% (835.36% growth).
Average Spend Per PPC Sale
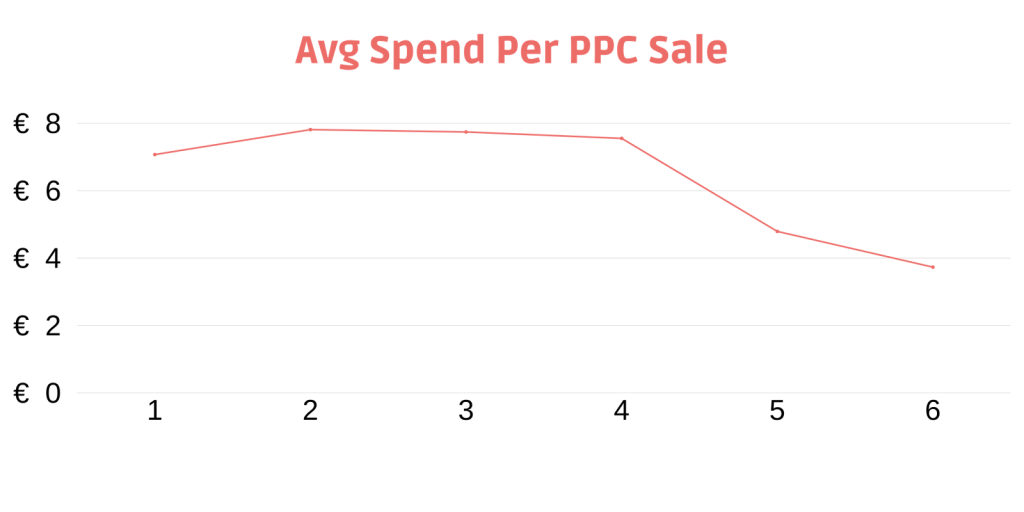
Average spend reduced from €7.07 to €3.73 (47.19% improvement).
Average Revenue Per PPC Sale
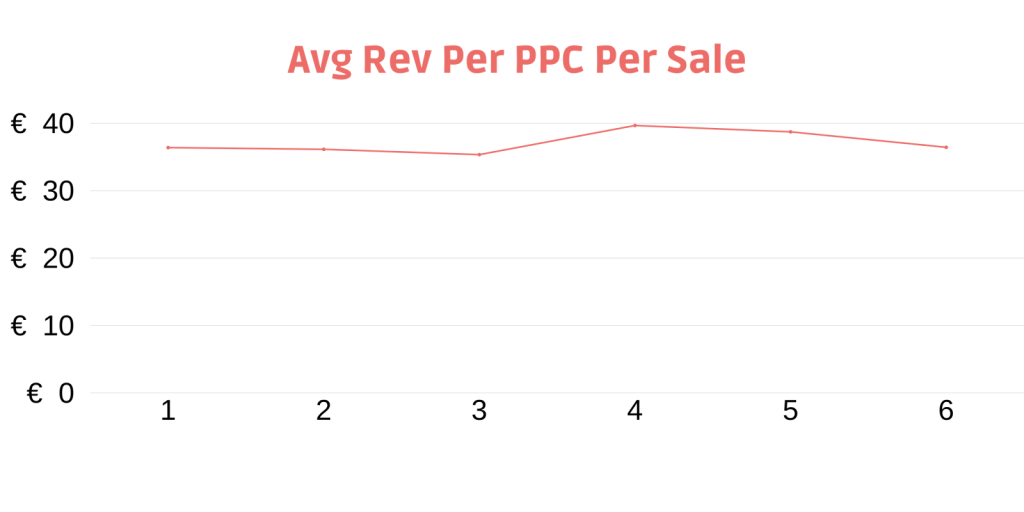
Average revenue remained stable, increasing slightly from €36.38 to €36.43 per unit (0.12%), with no new products or significant discounts during this period.
Average Clicks to PPC Conversion
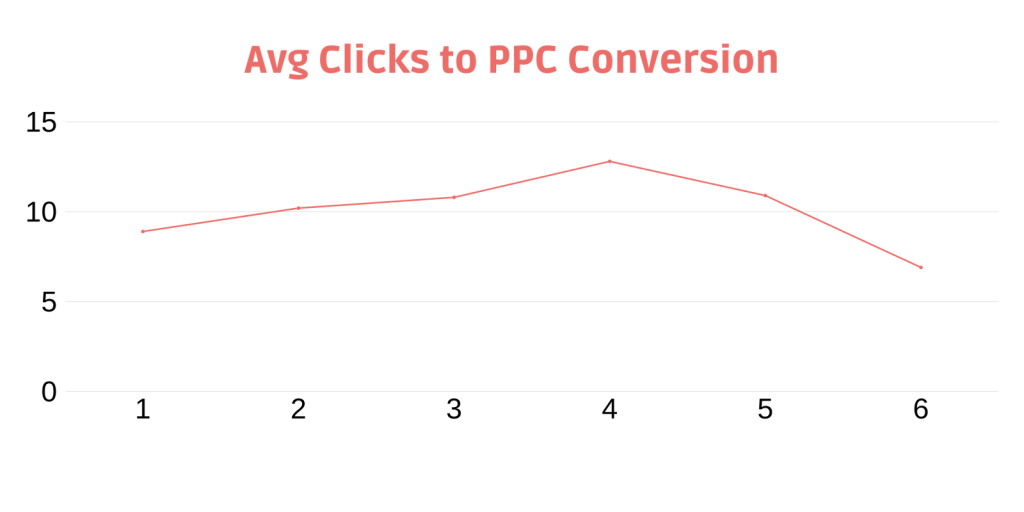
Clicks required for conversion decreased from 8.9 to 6.9 (21.88% improvement).
Average Impressions to PPC Conversion
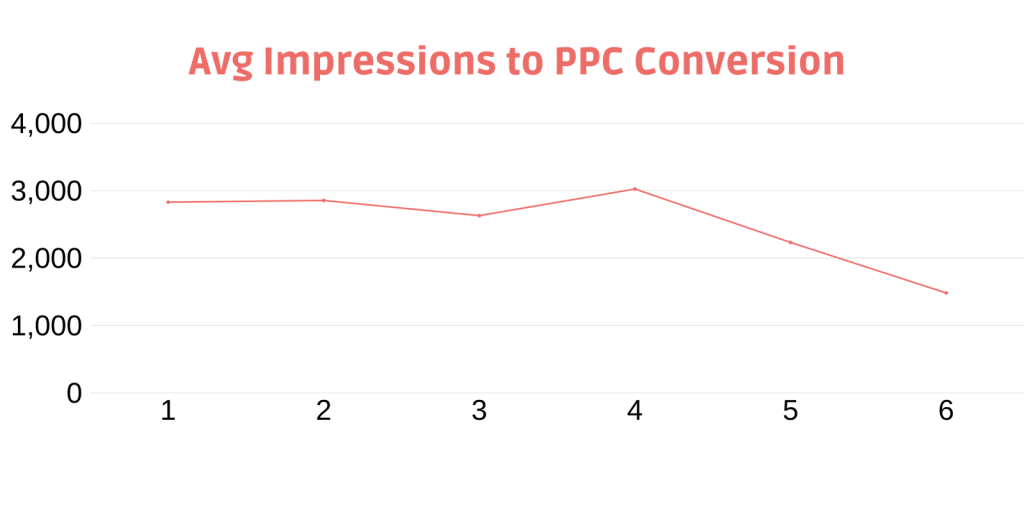
Impressions decreased from 2,829 to 1,482 (47.61% reduction), improving targeting efficiency.
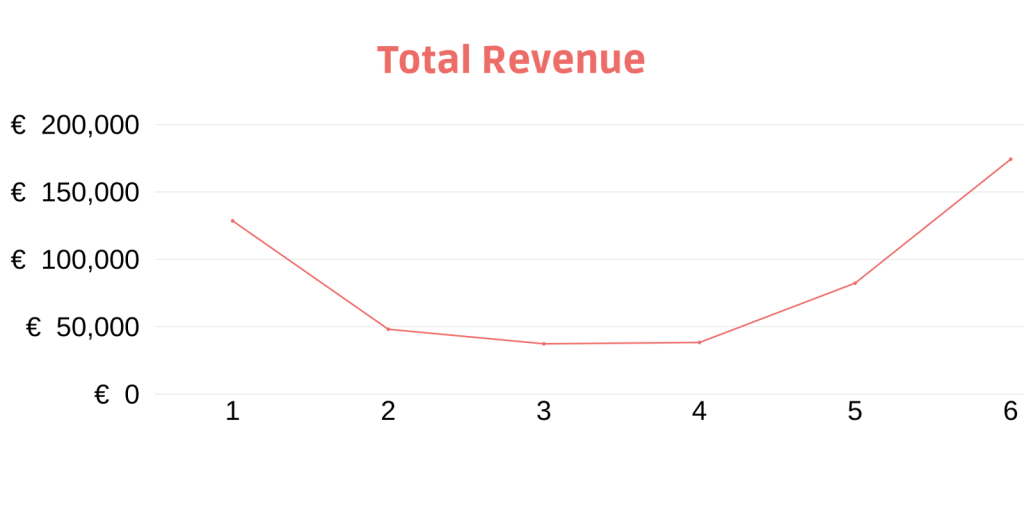
Total Revenue

Overall revenue grew from €128,587.64 to €174,296.54 (35.55% growth), demonstrating successful management through seasonal fluctuations.
Performance Summary
Key Achievements Across All Clients:
- Revenue Growth: 35.55% to 1,486.31%
- ACoS Reduction: 28.21% to 47.25%
- Conversion Efficiency: Up to 64.63% fewer impressions needed
- Acquisition Cost: Reduced by 21.65% to 47.19%
Work With Us!
The next step is to undertake discovery on your account. What is discovery? We would do an online call and review your storefront, along with discussing your targets and goals for growing your business.
- Initial discovery call to review your Amazon business
- Limited access to your Seller Central account to view Campaign Manager and Business reports
- Development of expected results and customised strategy
- Formal proposal with detailed terms and strategy document
- Welcome Pack with documentation of workflow, onboarding, FAQs and campaign launch date


